Followers

Thursday, October 13, 2016

How To Trade A Choppy Market

Hey folks,

Wanted to do a blog post on how i like to trade "PULLBACKS".

In choppy or sideways markets, i prefer to avoid trading 'breakouts' but instead focus on trading "pullbacks to support". This strategy has a much higher success rate than breakouts as most breakouts tend to fail in choppy markets. Breakouts work awesome in a TRENDING, momentum market but rarely work well in a choppy range-bound market.  

The overall stock market has been in a BRUTAL CHOP-FEST for well over a month now.
Very frustrating for most traders BUT it can be traded successfully. 

The Utility stocks(See XLU) caught my eyes in particular because last week I noticed the sector has taken a big beating recently. XLU and all Utility stocks were down 9-10 days in a row!! That's extremely rare to see and thought that we have an opportunity to make some money here. Notice how XLU actually crossed thru the lower bollinger bands(see chart) which has almost always led to a bounce shortly after...


So i started to look thru each individual stock in the XLU and SO caught my eyes in particular because it was testing the 200 day moving average after being down 9-10 days in a row. 

See chart below of SO daily chart.... which was emailed to ART OF TRADING members.  Notice how SO was testing the 200 Day Moving Average but also a trendline retest which now offered us a confluence of support to work with. Risk to Reward definitely favored LONGS, not shorts at this point! 


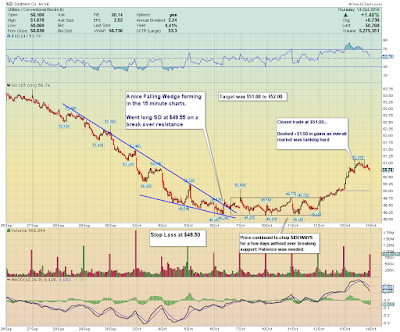
So i zoomed into the 15 minute charts for SO and spotted a nice FALLING WEDGE pattern, so i immediately tweeted, emailed and SMSed all ART OF TRADING members to get long SO; 


We booked a cool +$1.50 gain in this SO trade but what made this trade specially nice is that it was a long position which worked really nicely in a week where the overall market took a big hit. 

Remember this VERY important rule: 

In a very choppy(or bearish) tape, when you have a gain, you want to quickly book profits or raise stops because trends die fast in the chop. So book those gains while you have them! 


How To Trade A Choppy Market

Hey folks,

Wanted to do a blog on how i like to trade "PULLBACKS". In choppy, sideways markets, i prefer to avoid trading 'breakouts' and instead focus on trading "pullbacks to support". This strategy has a much higher success rate than breakouts as most breakouts tend to fail in choppy markets. Breakouts work awesome in a TRENDING, momentum market but rarely work well in a choppy range-bound market.  

The overall stock has been in a BRUTAL CHOP ZONE for well over a month now. 

The Utility stocks(See XLU) caught my eye on particular because last week as i noticed the sector has taken a beating. XLU and all Utility stocks were down 9-10 days in a row!! That's extremely rare to see and thought that we have an opportunity to make some money here. Notice how XLU actually crossed thru the lower bollinger bands(see chart) which has almost always led to a bounce shortly after...


So i started to look thru each individual stock in the XLU and SO caught my eyes in particular because it was testing the 200 day moving average after being down 9-10 days in a row. 

See chart below of SO daily chart.... which was emailed to ART OF TRADING members.  Notice how SO was testing the 200 Day Moving Average but also a trendline retest which now offered us a confluence of support to work with. Risk to Reward definitely favored LONGS, not shorts at this point! 


So i zoomed into the 15 minute charts for SO and spotted a nice FALLING WEDGE pattern, so i immediately tweeted, emailed and SMSed all ART OF TRADING members to get long SO; 


We booked a cool +$1.50 gain in this SO trade but what made this trade specially nice is that it was a long position which worked really nicely in a week where the overall market took a big hit. 

Remember this VERY important rule: 

In a very choppy(or bearish) tape, when you have a gain, you want to quickly book profits or raise stops because trends die fast in the chop. So book those gains while you have them! 


Monday, September 19, 2016

How To Swing Trade A Falling Wedge

Hey folks,

I wanted to share a STEP BY STEP trade analysis on a swing trade we did at the ART OF TRADING service.

In this post I'll explain HOW and WHY we bought and sold XIV to book a nice +7.4% gain in only 3 days!


Last week was a volatile and rather bearish week for the overall stock market. Sentiment turned quite negative as market took a pretty good whack. My game plan for the week was to look to "BUY THE FEAR" but wasn't gonna "blindly" buy and hope I was right. I needed a good technical signal with clear ENTRY and EXIT levels in case the trade falters.

But first I wanna show you what a basic "Falling Wedge" pattern looks like:


I like to trade Falling Wedges in stocks or in this case ETFs that are overall TRENDING UP and are pulling back in the form of a "Falling Wedge" pattern. So I am NOT looking to buy falling wedges in stocks that was previously trending DOWN!! That's a big NO-NO!
Remember, swing traders want to buy pullbacks in stocks/ETFs that are TRENDING HIGHER, not DOWN.

So I spotted these nice intra day Falling Wedge patterns in QQQ, IWM and SPY on Thursday(Sept 15th) as "doom and gloom" was the theme of the day on CNBC/twitter etc, following an ugly 3-4 day selloff that was triggered from jaw-boning by a FED member.
Remember, ALL that is NOISE!
As traders, we must tune out this "noise" and ONLY follow the PRICE ACTION!


Here's the Falling Wedge I spotted and actually shared these charts on twitter as well ....


So I noticed the Falling Wedges started to emerge on the 5 minute charts after a 4 day selloff, but more than importantly, notice that the RSI and the MACD were making HIGHER LOWS as the PRICE ACTION was making a LOWER LOW.... This is a hugely bullish signal and i'm always very interested in LONGS when I see this. Remember this! Train your eyes to spot them HIGEHR LOWS on MACD/RSI versus price action... Practice makes perfect!

So seeing this wedge and the strong bullish signal, ART OF TRADING members were issued a BUY alert via email/twitter/SMS for XIV long.
We entered XIV long at $32.60 and used $31.20 stop loss(stop loss was placed just below the Falling Wedge lows). A break of these lows and the trade would have failed, hence we need to take a loss if it happened. Winning traders take losses when they have to, DISCIPLINE is the name of the game.


Note on the below 30 minute chart, the price action made a 'HIGHER LOW' around the same time QQQ, IWM, SPY were pinching at the apex of those highlighted Falling Wedge patterns.
That's important as we are already seeing hints that XIV wants to reverse...
HIGHER LOWS are often the start of a bigger upside reversal.


 Note : in the chart below, the Nasdaq also made a HIGHER LOW at the same time, indicating relative strength in the Nasdaq/QQQ. This was yet another very bullish signal.


Here's how the charts are looking 3 days later....


....(On Sept. 15th at 11:15AM)....

We entered XIV long at $32.60 and sold it today at $35.00 using a trailing stop method.


We closed XIV for a +$2.40 or 7.4% gain!!

We kept walking up our stop losses and allowed the price action to dictate our next course of action, NOT the noise.

I hope you found this post helpful!

All comments, feedback or questions are welcomed!

You can tweet me or email me : Traderstewie@gmail.com

Happy trading !!


Wednesday, September 14, 2016

How To Spot The Best Bull Flags

Hey folks,

Yesterday on twitter I posted a nice BULL FLAG setup in YY (a stock who I have @WallStJesus to thank for bringing to my attention).

I wanted to do a quick blog post today on WHY I liked this setup so much and also HOW to spot them next time you are scanning for stocks to trade.

First of all, you must understand what a BULL FLAG looks like, please learn to look for these patterns as they are truly one of the most consistent and profitable patterns out there.

Here's what a typical bull flag looks like:


Here's the original YY setup I posted to ART OF TRADING members and also on twitter yesterday:


..... and here's how YY did today!


Now I'm gonna show you this same pattern in 2 other stocks that set up almost the same exact pattern this week: As I said earlier, I like to look for "classic BULL FLAGS" but I also add one VERY important element to my BULL FLAG setups.... VOLUME!

Price and Volume is all you really need to trade, everything for the most part is not really necessary.
When I look for volume in my BULL FLAGS, i'm looking for HUGE volume, aka ACCUMUALTION! Accumulation is basically super heavy volume that comes into a stock on UP days indicating very STRONG institutional demand for a stock. Institutions is what moves stocks so when I see accumulation volume come into a stock for several days in a row, that makes me pay close attention to this stock and so should you!

Here's the same BULL FLAG pattern in CYOU and SOHU but more importantly look at the VOLUME PATTERNS! Look at that massive accumulation volume as the stocks work their way higher, strong volume accumulation continues to pump into the 3 stocks.
Very strong indication, institutions WANT IN !


Do you see any similarities between CYOU, SOHU and YY?


Will you be able to spot this pattern? 

I'd love to hear your comments, feedback, questions on this post! 

Happy trading!


How To Spot High Quality Bull Flags

Hey folks,

Yesterday on twitter I posted a nice BULL FLAG setup in YY (a stock who I have @WallStJesus to thank for bringing to my attention).

I wanted to do a quick blog post today on WHY I liked this setup so much and also HOW to spot them next time you are scanning for stocks to trade.

First of all, you must understand what a BULL FLAG looks like, please learn to look for these patterns as they are truly one of the most consistent and profitable patterns out there.

Here's what a typical bull flag looks like:


Here's the original YY setup I posted to ART OF TRADING members and also on twitter yesterday:


..... and here's how YY did today!


Now I'm gonna show you this same pattern in 2 other stocks that set up almost the same exact pattern this week: Now, I like to look to classic BULL FLAGS and I also add one VERY important element to my BULL FLAG setups.... VOLUME!
Price and Volume is all you really need to trade, everything for the most part is not really necessary.
When I look for volume in my BULL FLAGS, i'm looking for HUGE volume, aka ACCUMUALTION! Accumulation is basically super heavy volume that comes into a stock on UP days indicating very STRONG institutional demand for a stock. Institutions is what moves stocks so when I see accumulation volume come into a stock for several days in a row, that makes me pay close attention to this stock and so should you!

Here's the same BULL FLAG pattern in CYOU and SOHU but more importantly look at the VOLUME PATTERNS! Look at that massive accumulation volume as the stocks work their way higher, strong volume accumulation continues to pump into the 3 stocks.
Very strong indication, institutions WANT IN !


Do you see any similarities between CYOU, SOHU and YY?


Will you be able to spot this pattern? 

I'd love to hear your comments, feedback, questions on this post! 

Happy trading!


Tuesday, August 9, 2016

Day Trading via a Falling Wedge

This morning I took a day trade in ZBRA which set up nicely intra day in a Falling Wedge pattern...

What I love about Falling Wedges is that the pattern can set up and deliver very reliable outcomes on many time frames, whether it's MONTHLY, WEEKLY, DAILY, 60, 30, 5 or even 2 minute charts as you'll see in this case.

For this ZBRA trade, it was flagged on my Finviz scanner as an Earnings Gapper. ZBRA gapped up after announcing good earnings. Once that happens, I start looking for intra day pullbacks off the open(Via a FALLING WEDGE pattern preferably).

Saw the initial Wedge using the 2 minute charts of ZBRA. Stock started to narrow at the bottom of the wedge, took a small size position of 500 shares at $60.97 ..... stock responded positively almost right away and started climbing, sold it at $61.43 .... A quick 50 cents gain(or $250 profit) in about 30 minutes.


8/9/2016 11:03:41 AM ETZBRA Sold 500 ZBRA @ $61.439
Executed

8/9/2016 10:37:15 AM ETZBRA Bought 500 ZBRA @ $60.9692Executed


Hope this helps you in your trading !


Monday, August 8, 2016

How To Spot a FALLING WEDGE ?

A fellow twitter follower @BuckeyeTrader87 asks me a great question on twitter today about
"Falling Wedges" which surely by now everyone knows they are by far my favorite pattern to trade both INTRA DAY day trading and also for Swing Trading. Spotting them can be quite tricky. Or at least the kind of Wedges I like to look for and trade, these can be kinda tricky to spot.

Adam asked about NFLX .... So here's a more detailed chart of what i'd be looking for in NFLX over next few days/weeks in order for this stock to set up the typical "Falling Wedge" pattern I like to look for.


Below is the 1 year DAILY chart view of NFLX.


I hope this helps !!


Tuesday, August 2, 2016

ERY Trade : Step by Step Explanation

Coming into today, I was looking for a continued weakness in Crude Oil and/or Energy stocks a whole based on recent chart action that has been getting quite bearish.

Yesterday: I tweeted this ERY Daily chart to 'ART OF TRADING' members around mid day:

"Keep an eye on this ERY going into today's close and/or tomorrow morning for an entry. We might do an alert ERY soon.
I love this bottoming pattern"


I didn't want to chase a 10% pop in ERY so I waited on sidelines and wanted to see a gap down or a weak open for ERY and then look for an entry.

So Tuesday morning, ERY gapped down at the open and then I started to look for good spots to enter based on the 5 minutes charts: See chart below:


Entered ERY long at $16.25  ------ Sold it at $16.85 for a 3.6% gain in about an hour and half holding time.

Even tho ERY probably has more room on upside, I tend to walk up my stop losses fairly quickly to lock in gains when I can.

Hope this post was helpful!
Good trading !


ART OF TRADING Member Reviews : HERE


Blog Archive