Followers

Tuesday, November 30, 2010

Chopfest!

See the attached chart and you will quickly see why 1200 on SPX on the upside is so important and you will also see why 1170 on SPX on the downside is so important! Right now, we are stuck in between these two battle lines. Hence, the CHOP!

I hate trading choppy markets. Not sure about you?

Unless you are a very nimble trader, i.e. Entering trades quickly flipping them quicker, than it's best to chill out here and take a passive approach.

Saturday, November 27, 2010

Awesome Review From A BRAND NEW Art Of Trading Member!!

"Great stock picks and Excellent Personal Service

I am new to the Art Of Trading's premium site but I have been watching trader stewie through twitter and have taken some of his stock picks from there. I gave the art of trading a try because I had tried several other sites that just did not suit my style of trading and I had read great things about this service. In my first trade, I made enough to pay for several months of the subscription. Before I had even taken the trade, stewie was emailing me to see if I had taken it and once I did, he kept in touch just to see how I was doing with it. I realize that this is not something that he can do with every single trade or every single person but when I have a question, I email him and within minutes I have a response.

I highly recommend giving the art of trading an opportunity. I believe that this will be a great investment for you financially but also in terms of personal growth. You will learn why trades are made and how they find the stocks that he is trading. I don't recommend just taking each trade without knowing what you are doing as this will not help you. You need to take the time to learn why trades are made and this service will help you with that.

The personal attention is what I like most about this service. I highly recommend giving stewie the opportunity to prove what he can do for you. I think that you will be satisfied with the results.

Marco"


This Is What The ART OF TRADING Is All About!!

See more reviews here!

Thursday, November 25, 2010

Art Of Trading Member Ready To Go Full Time!!

"Thanks for everything Stewie. Your service not only provides great stock picks but also a superb learning enviornment in your chat room. Traders like your veteran subscibers are a wealth of knowledge and skill. I have made great money as a subsciber and am getting closer to my goal of trading full time. I couldn't do it without your experience and guidance. Thanks again and have a happy Thanksgiving."

M-Jacob

10 High Probability Stock Setups


At this point, i could care less what the indexes do(most likely move sideways or slightly higher short term), the setups that are popping up in my scans are extremely encouraging from a bullish perspective. Gonna focus on playing individual charts for the time being. Buying weakness in strong names continues to be the most consistent winning strategy.
If it ain't broke, don't fix it.

Trade em well!

Wednesday, November 24, 2010

Art Of Trading Success Stories!!!


This is what the ART OF TRADING is all about!!


I picked up some AMZN weekly calls this week based on your recommendation of the stock. I'd been watching it but you pushed me to think about it hard.

Picked up AMZN 170 calls for 1 yesterday sold for 7 today for a nice swing trade on this option.

Nice little turkey day gift.

Happy Thanksgiving.

Regards,

Eric


Happy Thanksgiving, Stewie! Your market and stock commentary has been EXTREMELY helpful to my trading. I have made a lot of money from your commentary alone. Thanks a lot for everything! Have a great holiday!


Scott


This was great day for me and a very good week. Here are my trades:

TRS +5.3%
MWW +4.5%
WRES +3.5%
AEO -0.5%
PCX 0%
ENTG +2%

I am in GGAL and GSM with you. Also have THO and SCSS. All green and GGAL super green :)
Thanks to You, NYC, Mautz, Fuinha for valuable advices, sharing setups, helping me with targets/stops and making me a better trader.
I am so lucky I found your service!

Laura


Stewie,

I booked close to $600 using reduced positions based on your alerts this week. Good job! It is a wonderful way to start the holiday break.

Gin


JOIN US FOR A 14 DAY FREE TRIAL and CHECK IT OUT!

What are you waiting for?!


Emails Sent To ART OF TRADING Members Yesterday


Hi guys,

Market tanks today but no major support levels have been breached. Will continue to hold our long positions, as thus far they are holding up rather well given the market's weakness. Tomorrow(Wednesday) and friday expect low volume sessions. I would not be surprised to see a big rally come in on Wednesday or Friday. Thursday, the market are closed and Friday is a half day.


As of now, everything i am looking at is telling, this is a just another NEWS DRIVEN selloff. These kinds of selloffs have been buying opportunities in the past. From where i am sitting, this is just another buying opportunity.

Tuesday, November 23, 2010

Special Shoutout To The Chat Room Veterans!

Hi guys,

I wanted to take a minute and thank the chat room veterans, the guys who are in there religiously DAILY since "day one". These guys are dedicated members who have been there with a helping hand and ready to answer all questions from the lesser experienced traders. Guys, who i have personally seen grow as traders and literally become leaders in their own craft. This is the kind of leadership to which i imagine many other traders who walk thru these doors to become: Strong, confident, independent, self-reliant, passionate, helpful, honest, skillful, and generous. These guys are truly world class people who specialize in their field of expertise and these are people whom i personally admire and consider myself very lucky to be associated with them.


Thank you:

Fuinha, Swooned, NYCtrader, Lasertrader, Yanivicious, Stan.

Keep doing what you do and this list is surely going to grow! I have no doubt in my mind.

Building confidence, one trader at a time at the ART OF TRADING!


God bless.

Monday, November 22, 2010

Stocks That Can Be Bought On Weakness


One Of The Best ART OF TRADING Member Success Story!!

This is by far one of the BEST Art Of Trading Success Stories!!! Big time congrats to Andy!!


Hi STW,

I was evaluating my trading performance over the past year after I subscribed to your service and I wanted to thank you for teaching me so much about the market, stocks, charts, and patterns. With your help, I've grown more and more comfortable in recognizing chart patterns and when a market uptrend/downtrend is in play, find the stocks/sectors that are gaining momentum, and have been able to identify market leaders that help lead the trends.

I had taken a break from trading during the period of correction a few months ago as I was getting discouraged with my performance so I took the time to read, study and analyze my prior trades to figure out what I was doing wrong. Much credit is given to your service as a lot of the learning came directly from your emails or chat room. Though I have so much more to learn, I can definitely feel myself much improved than when I first started your service.

I started trading again when I felt like the market was beginning an uptrend in Sept and have had a nice +45% trading performance since then. It was only through your teaching that I was able to recognize the downtrend and then the uptrend during that time.

Thanks a lot for taking the time to quickly answer my questions and thanks for the consistent emails everyday that gives me the insight from a trader whose opinion I very much respect.

Andy K.

Sunday, November 21, 2010

New Long Setups To Watch


I am bullish into Turkey week. I will buy any dip we may see. I am already long going into monday and i will be looking to add more long exposure. These 5 stocks are some of my favorites going into the new week.

Good luck!

Stewie's Braised Lamb Shanks!!


Ingredients

  • 1 tablespoon coriander seeds
  • 1 tablespoon fennel seeds
  • 1 teaspoon black peppercorns
  • 1 tablespoon salt
  • 4 large lamb shanks
  • 2 tablespoons canola oil
  • 1 onion, minced
  • 2 carrots, peeled and diced
  • 1 celery stalk, minced

  • 1 1/2 cups red wine
  • 1 cup beef stock
  • 1 head garlic, halved
  • 3 sprigs fresh rosemary
  • 3 sprigs fresh thyme
  • 2 tablespoons butter
  • 3 tablespoons honey
  • Kosher salt and freshly ground black pepper

Directions

Mix the coriander, fennel, and peppercorns in a small frying pan. Toast on medium-high heat until aromatic and slightly darker, about 2 minutes. Using a mortar and pestle or a spice grinder, crush the spices. Add the salt. Rub each shank with the spice blend.

Preheat the oven to 325 degrees F.

Heat the oil in a large oven-proof skillet over medium-high heat. Add the shanks to the skillet. Cook until brown on all sides, about 5 minutes. Add the onion, carrots, celery, and leek. Saute over medium heat until the vegetables begin to soften, about 5 minutes. Add the port, veal stock, garlic, rosemary, and thyme to the skillet.

Cover the skillet with a lid or foil. Place the skillet in the oven and braise the lamb until tender, for 2 to 2 1/2 hours or until the meat falls off the bone. Remove the lamb shanks from the skillet and filter the sauce through a fine sieve over a stockpot. On medium heat, let the sauce reduce by 1/2, for about 15 minutes.

Meanwhile, in another skillet, melt the butter and add the lamb shank. Coat them with honey. Caramelize the shanks on all sides over medium heat on the stove for about 5 minutes, adding a ladle of the sauce. Keep warm.

Serve the lamb shanks with the sauce and garlic roasted mashed potatoes.


Thanks Chuck Hughes for this awesome recipe. Of course, i added a Stewie twist to this recipe. and changed it up a little bit.

Make sure to check out his TV show on Food Channel called "Chuck's Day Off".

Friday, November 19, 2010

What's "Under The Surface"?

A fellow ART OF TRADING member earlier today asked me how I read the tape?? Here is my best response. Hope it helps.

First of all, "reading the tape" comes from tons of experience from sitting in front of the trading screens for many hours over many years! Experience cannot be taught in all honesty.

Having said that:

Here are some things i look for when a market's character is changing. First of all, let me explain what i mean when i use the term: "UNDER THE SURFACE". Think of it like this: When your car has a problem and you take it to your mechanic. The mechanic will never know what the problem is with your car unless he looks UNDER THE HOOD. Right?

After the mechanic looks and inspects UNDER THE HOOD, he slowly starts to spot possible problems and only after a thorough and detailed inspection under the hood after using various methods does he come to a conclusion of what could be troubling your car.

Picture the same thing with reading the tape while trading!

I like to think of myself as a 'blue collar' trader: I have a very simple system which in this new generation of technology could be considered 'old school'.

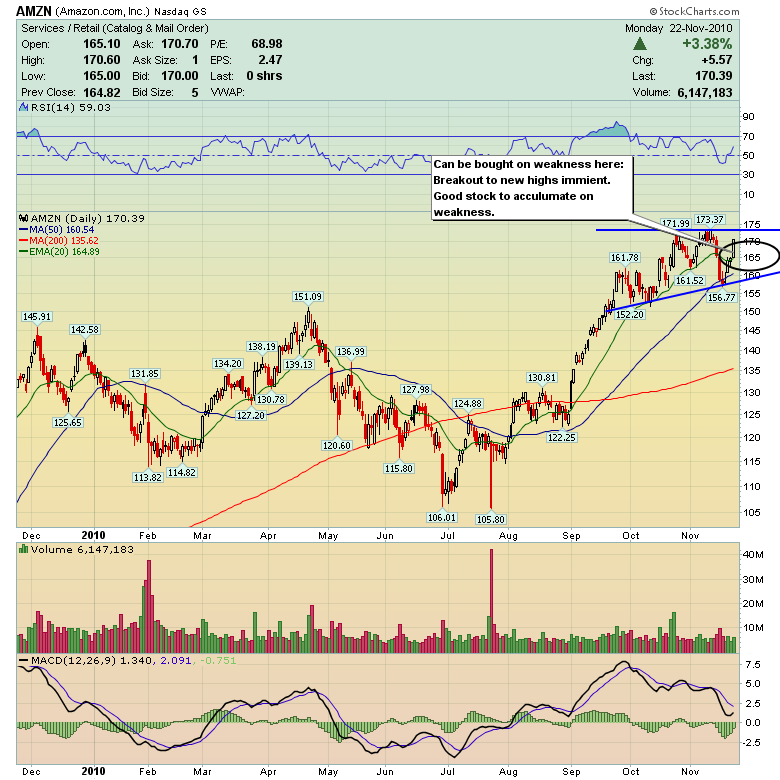
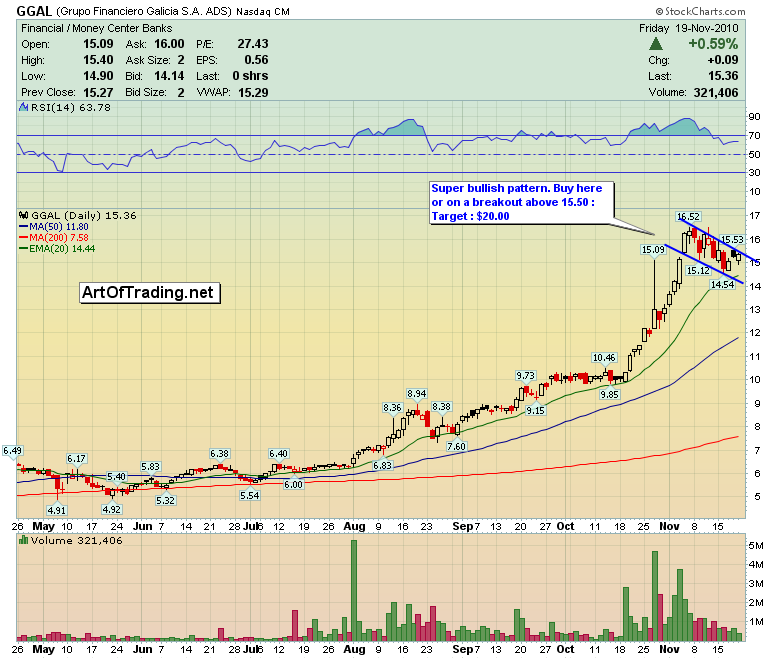
Every single day and through out the day, i scan for stocks that are either advancing on heavy volume, breaking to new 52 week highs, or tacking on high percentage gains. I track these stocks for many days and sometimes even weeks. I consider these "the leaders" at that particular point in time. I track and watch these stocks in my stockcharts.com watchlists. I have many lists and i track literally between 200-400 stocks. I am always looking for new candidates by adding and deleting new leaders. Do not think of it as the 'stock market' but as a 'market of stocks'. Stocks move the indexes. A lot of times, stocks either top out of bottom before the major indexes do. So watching how individual stocks are behaving is key to my system.

I need to know how my watchlist is progressing or not progressing. How leading stocks are moving is very important to the health of a market. If stocks are moving on strong higher and breakouts are seeing follow through, this is a very important development and quite bullish. Vice versa, if market leading stocks are starting to see some signs of heavy volume selling days(distribution), and lack to follow thru on breakouts(failed breakouts) then it's time to be cautious and raise some cash, tighten stop losses be very selective on how or when you enter new positions. Markets go up 'slowly' but they drop very quickly! Fear is a much stronger emotion greed. A stock could go up 20% in one month but it could drop 20% in a single day easily.


Market internals: meaning number of advancing versus declining issues. During a strong rally phase: Seeing: 3 advancing to 1 declining ratio, 4 advancing to 1 declining, 5 advancing to 1 declining, 6 advancing to 1 declining or more advancing versus declining stocks ratio is very healthy! Vice versa for bearish trends or bearish days.

During a rally phase or rally day. I wanna see how stocks 'UNDER THE SURFACE" are moving. If stocks under the surface, are moving very strongly on strong volume and intra day opportunities are plentiful, i.e.: 'easy' to spot and 'play', then i feel 'confident' in a rally's lasting powers. If however a rally looks good on 'paper' but intra day the action looks poor, i.e. light volume and/or sloppy with numerous failed intra day breakouts, then i become highly suspect of the rally and the 'under the surface' strength of the move cannot be trusted.

If i see a pattern of numerous rally days where the indexes tack on gains but the 'under the surface' action looks poor or find it difficult to play, then i become very cautious. Remember, during a healthy advance, opportunities are plentiful and easy to spot!

Also, always try and keep track of what trader sentiment is like on twitter, stocktwits, CNBC, etc etc. Try and be a contrarian. 'Listen' and 'watch' other traders and the sentiment that comes along with it. A depressed or fearful "tone of voice" from many traders tells me that a bottom is very near. The stock market is pretty much exploiting investor sentiment.

“Be Fearful When Others Are Greedy and Greedy When Others Are Fearful” - Warren Buffett


Another note i want to add is it's always to pay attention and how "EASY" is it to make money in a market?? Are most traders you are watching making lots of 'easy' money?? Remember, when most traders make a killing betting on one direction, the party might be over on that particular direction. The market loves to fool most of the people most of the time! Sucks everyone in one direction, gets everyone 'comfortable' doing a particular thing and then pulls the rug from underneath everyone right when everything started to seem 'easy'.

The market will almost always reward the 'HARDEST' trade: Before you start to analyze a stock or a market : Ask yourself first and foremost:

What is the hardest trade to make RIGHT NOW?? What trade would make most other traders most nervous?? Would buying this dip here make other traders most anxious?? Would shorting this huge gap up make other traders most nervous??

Thursday, November 18, 2010

Between A Rock And A Hard Place


The index charts are a complete mess at this point. We are literally stuck between a rock and a hard place! Very hard to tell what the indexes wanna do here: My Guess is we are likely going to see some choppy sideways action for the next few days. So be prepared for this and be very careful chasing strength and shorting weakness. This might not be the best strategy!

Attached is the NYMO chart which bounced nicely today as anticipated and we are no longer oversold as of now. So a few days of digestion is to be expected.

I also attached a chart of the DIA 60 min charts: which shows that we literally hitting resistance right here, right now. Even more reason to expect some hesitation and some digestion around this zone.

And a chart of JKS as a possible play for tomorrow or monday. Looks prime for a bounce soon.

Tomorrow is Options Expiration(OPEX) so be even extra careful as you will likely see some strange things happening in many names.

Art Of Trading Member Seeing Better Results!

Kudos to Leonel who went through a tough time (like most traders do at some point in their careers) and fought his way thru it and now had this to say:


"Stewie, since subscribing to your service this past spring I've noticed you have a great ability to determine whether we're in a healthy market or if there's trouble ahead. Do you use market breadth, new highs-lows, advance decline line, or some other indicator to gauge the true state of the market? You always mention under the surface so would like to know what you're looking at. Thanks again.

By the way, I've made some tweaks to my system first from paper trading and now back with real money. I just made my position sizes a little smaller so I could participate in a swing move and at the same time not be shaken out by a little market volatility and am seeing much more consistent and better results. Thanks for all your help.


Leonel"

Wednesday, November 17, 2010

Top 5 Long Setups To Watch


If we rally thursday and/or friday, then these 5 stocks are on top of my longs watchlist.

Good luck.

Market Thoughts


As markets pullback and/or selloff, it's normal to see many stocks loose levels of support. Fear starts ramping and people are willing to sell out at any price to ease the pain of holding on to something that is dropping in value. However, after pullback phases are over, there's a rebuilding phase where stocks take a few days to rebuild their broken bases or patterns. This is very healthy however, it can be very tricky to trade thru it. The action tends to be very sloppy and choppy. Lots of STOP AND GO action. I have found it much less stressful to just wait and allow the bulls and bears to fight it and then jump on to the winning side once the REAL move starts to emerge.


The 'bounce' we are seeing today thus far in stocks looks of the 'dead cat' bounce variety. After yesterday's high volume selloff, it's normal to see some stocks trying to bounce some here. I am not going to chase anything here. It is much better to chill for a bit and see how the action unfolds. We broke many layers of support yesterday, these levels of support have now become RESISTANCE. So if we move higher from here, these over head resistance levels will be very tough to overcome and will require some time.

Attached is the NYMO chart: Which shows that we are currently at very oversold levels so a bounce here is very possible. Remains to be seen.

Bottomline: This market just needs time! So exercise some patience. Use smaller size if you decide to trade next few days.

Sunday, November 14, 2010

No Setups This Weekend


Why? Because i see nothing to play in all honesty. I have plowed thru hundreds of charts and i see nothing that i deem 'high probabililty' plays. The good setups are lacking once again making me think rallies are going to have a hard time sustaining themselves for a while.

I am attaching charts which to me have caught my attention:

1. The GLD chart which looks to be putting an ISLAND TOP. This chart makes me think that gold and likely other commodities are headed lower before another big move up is ready.

2. The SPX 60 minute chart which is my 'road map' showing that we are potentially approaching some zones of support near that 1190 area.

3. The NYMO chart shows we are entering shortterm oversold levels conditions but not too oversold to the point where we cannot go much lower. There is still some room left of more downside in my opinion before we reach truly oversold levels from which we can launch higher into year end. I believe there will be a 'santa rally' brewing but the only thing on my mind right now is from how low will it start?

We are gonna have to wait and see how we shape up as we enter the new week. Patience is very very important now and we need to gather more price data before more confident calls about direction can be made.

LESS IS MORE right now.

Good luck next week!

Friday, November 12, 2010

60 Minute SPX Analysis


Here is a 60 minute chart of the SPX: Tomorrow's open is likely to test some support levels. This is a good chart to watch going forward.


Personally i'd love to see a 3-5% drop from SPX 1230 high. Watch this chart going forward as it lays out clear zones of support. I do not believe the rally is over but i do believe the bull's cage NEEDS to be rattled and infuse some much needed fear back into the market to clear the path for a year end santa rally.

Good luck trading em tomorrow guys!


Wednesday, November 10, 2010

Art Of Trading Member Locks In $7500.00 In Profits In 2 Months!!

"STEW,
I told you that I have been doing well lately. I highly appreciate your help and other members' help like Fuhina, Mautz, Stan, NYCtrader, Lauren and many others from the chat room who are willing to answer any question at any moment. I'm sending you my trading history for the past months of October and November. I see that my losses, though not many in number, are big and affect the final result. If you have any suggestion to improve my performance I would be more than grateful.

SILVINA"


A B C D E F G H I J K
1

STOCK


GAIN/LOSS
2
OCTUBRE


3 9/29/10
LTD 27.48 500.00 13740.00
13821.75 27.6435

4 10/7/10

28.7 500.00 14350.00
14264.62

442.87
5


6 10/1/10
TIE 20.35 1000.00 20350.00
20471.08 20.47108

7 10/7/10

19.75 1000 19750
19632.5

-838.58
8


9 1/1/10
VECO 34.11 300.00 10233.00
10303.00


10 12-Oct

36.6 300 10980
10910 607.00
613
11


12 12-Oct
OCLR 16.37 1000.00 16370.00
16467.40


13 13-Oct

16.89 1000.00 16890.00
16789.50

322.10
14


15

VECO 35.7 300.00 10710.00
10785.00


16 13-Oct

41.01 300.00 12303.00
12229.80 1444.80
1450
17


18 10/13/10
AKS 14.67 1000.00 14670.00
14757.29 25/10 EARNINGS

19 22-Oct
AKS 13.27 1000.00 13270.00
13191.04

-1566.25
20


21 10/14/10
CREE 55.56 200.00 11112.00
11042.00 242.00
242
22


23 10/22/10
TER 11.52 1500.00 17280.00
17382.82


24 28-Oct

11.78 1500.00 17670.00
17564.86

182.04
25


26 15-Oct
MIPS 9.75 1000 9750
9820


27 21-Oct

10.1 1000 10100.00
10028.20

208.20
28


29 26-Oct
TIBX 19.16 800.00 15328.00
15419.20


30


19.3 800.00 15440.00
15348.13

-71.07
31


32 26-Oct
MIPS 11.92 1000 11920
11990.92


33 10/26/10

12.974 1000 12974
12896.8

905.88
34


35 22-Oct
MIPS 10.31 1000 10310
10380

50
36 25-Oct
MIPS 10.5 1000 10500

10430

37


38 15-Oct
DMAN 10.75 1000.00 10750.00
10820.00


39 15-Oct

10.75 1000.00 10750.00
10680.00

-140.00
40


41 28-Oct
GFA 16.49 1000 16490
16588.12


42 11/1/10

16.95 1000 16950
16849.15

261.03
43


44 28-Oct
VHC 18.48 1000 18480
18589.96


45 29-Oct

19.4 1000 19400

19284.57
694.61
46


47 10/4/10
RAS 1.74 5000 8700
8770


48


1.92 5000 9600
9530

760
49


50 12-Oct
IMAX 17.442 1000 17442
17338


51


18.05 1000 18050
17942.6

604.6
52


53 15-Oct
TWI 15.09 1000 15090
15179.5 STOPS AT 14.1
-969
54 21-Oct

14.3 1000 14300
14210.5


55


56 25-Oct
SPRD 12.977 1000 12977
13054.21


57 26-Oct

14.57 1000 14570

14483.31
1429.1
58


59


4580.53
60


61 1-Nov
PIR 8.84 2000 17680
17785.2


62 11/2/10

9.2506 2000 18501.2

18391.12
605.92
63


64 1-Nov
JKS 35.5 500 17750
17855.61


65


33.9 500 16950

16849.15
-1006.46
66


67 1-Nov
CPX 24.37 500 12185
12257.5


68


25.95 500 12975

12897.8
640.3
69


70 11/4/10
BIG 29.41 600 17646
17751


71 8-Nov

30.2 600 18120
18012.2

261.2
72


73 5-Nov
CPE 5.24 2000 10480
10550


74 5-Nov

5.55 2000 11100
11030

480
75


76 8-Nov
DCTH 8.94 1000 8940
9010


77 9-Nov

9.85 1000 9850
9780

770
78


79 9/16/09
DRYS 185 7.57 1400.45
1480


80 10/13/10
DRYS 1000 4.76 4760
4830.00 6310.00

81 10/21/10
DRYS 1000 4.33 4330
4400.00 9230.00

82


2185


10710.00


83 11/4/10
DRYS 1500 4.3 6450
6520.00


84


3685


17230.00


85 11/9/10
DRYS 3685 5.02 18498.7
18388.70

1158.70
86


87


2909.66

Blog Archive