Followers
Sunday, April 29, 2012
Where's The BEAR IN These Charts?
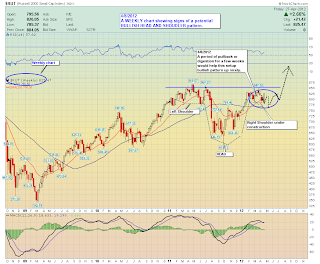
It's been a long while we haven't looked at the index charts and the sector charts to help us see what's going on UNDER THE SURFACE. Attached, you will see a plethora of charts breaking down the sectors with MONTHLY, WEEKLY and DAILY charts. Tune out all the "noise" you hear all day, every day and keep it simple. Interpret charts with objectivity.
DO YOU SEE A BEAR here? Do you really??
Subscribe to:
Post Comments (Atom)
Blog Archive
-
▼
2012
(58)
-
▼
April
(7)
- How To Trade A Bullish Falling Wedge Pattern
- Where's The BEAR IN These Charts?
- SammyWise's & CockyNate's Adventures In Trading
- How To Trade DIP BUYS : Support Pull Back Trades
- Trade Video Review : MNST Breakout Trade
- ART OF TRADING Member Had His First $1,000 Profit ...
- ART OF TRADING Weekly Member Feedback!
-
▼
April
(7)
Cool Traders/Sites
- ART OF TRADING Premium Site
- Charting Trends blog
- Denarii
- Finance Trends bog
- It's Gold
- Keep Unread Blog
- LaserTrader
- momentum trader
- My Trader Interview
- Mystic Stocks
- NYC Trader
- Rant About It Blog
- stock rook goes pro
- Stock Virtual
- StockPursuit.com
- The Market Guardian
- thecrosshairstrader
- Todds Trade
- trader market blog
- Trader9999 blog
- Trading Momentum blog
- Trading With Average Jay
- Wall Street Warrior


No comments:
Post a Comment