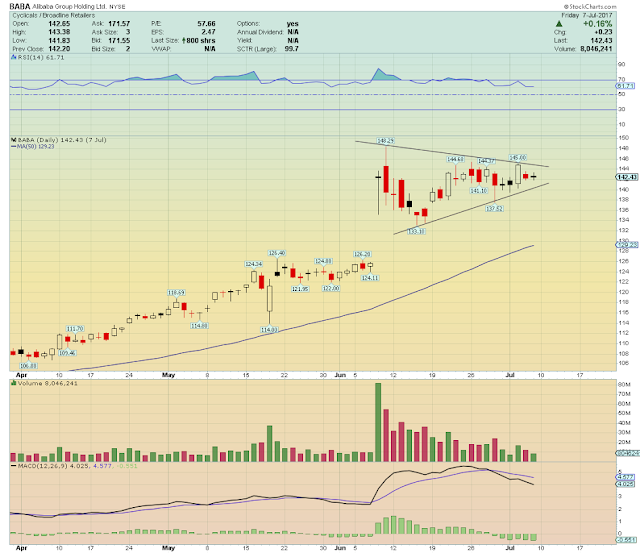
Earlier today, I gave AOT members a "Pop Quiz" ....
Two questions:
1: What is the technical name of this pattern seen in the BABA chart below?
2: And what are the price targets for this chart pattern?
The BABA chart shown in the POP QUIZ was actually from April to July of 2017....
I did that purposely so that I can show you what BABA did after it triggered and broke out...
And just for fun, I decided to also give my Twitter Followers the same POP QUIZ !!
First 5 correct answers will get a FREE gift from me!!
Thank you to all who participated in today's POP QUIZ and many of you did !
So here are the answers i was looking for:
The chart pattern shown in the above BABA chart is technically called a: Symmetrical Triangle
Here's what it looks like:
..... and here's another example ...
Symmetrical triangles generally are "neutral patterns with equally sloping lines on either side that converge into a triangle's APEX upon breakout time....
GENERALLY they break in the direction of the prevailing trend.... so in BABA's case, the prevailing trend was clearly UP so it was UP, UP and AWAY for BABA!!
It surely did not disappoint !
So based on that symmetrical chart pattern highlighted in BABA, the ideal technical entry would be to go LONG on a breakout thru the apex of that symmetrical triangle(so at the $145 area).
Two targets for this trade:
First target is: $153
Second target is: $160
..... and here's how BABA did after that SYMMETRICAL TRIANGLE .....
As you can see from the above BABA chart, the $153 and $160 targets were fairly accurate for that particular trading pattern! Don't ya think?
A few of you got it spot on so I'll contact you and email you your free Trading Ebook gift tomorrow morning!
I hope this helps!
As always, if you have any questions, comments or feedback, please let me know!!
Happy trading!


No comments:
Post a Comment